Micron Technology (MU): The Memory Supercycle Is Only Getting Started — Full Equity Deep Dive
- The Financial View
- May 7
- 10 min read
The Financial View | Equity Deep Dive | May 2026
MICRON TECHNOLOGY (MU)
The Memory Supercycle Is Only Getting Started
I. Executive Summary
We rate Micron Technology a BUY. Our 12-month base-case price target is USD 720 (12% upside from the May 2026 close near USD 643). Bull case: USD 1,100. Bear case: USD 450. MU is our highest-conviction Lens A position in TFV Capital's virtual portfolio at 17.9% of equity.
The market prices Micron as a commodity cyclical. It is wrong. HBM3E is not DRAM — it is a co-engineered, yield-constrained product sold under multi-quarter supply agreements to NVIDIA, Google, AMD, and Microsoft. Businesses with backlogs do not trade at 7x earnings.
One sentence: Micron is the only pure-play Western HBM supplier in a market where demand chronically exceeds supply, and it still trades like a commodity.
II. Business Overview
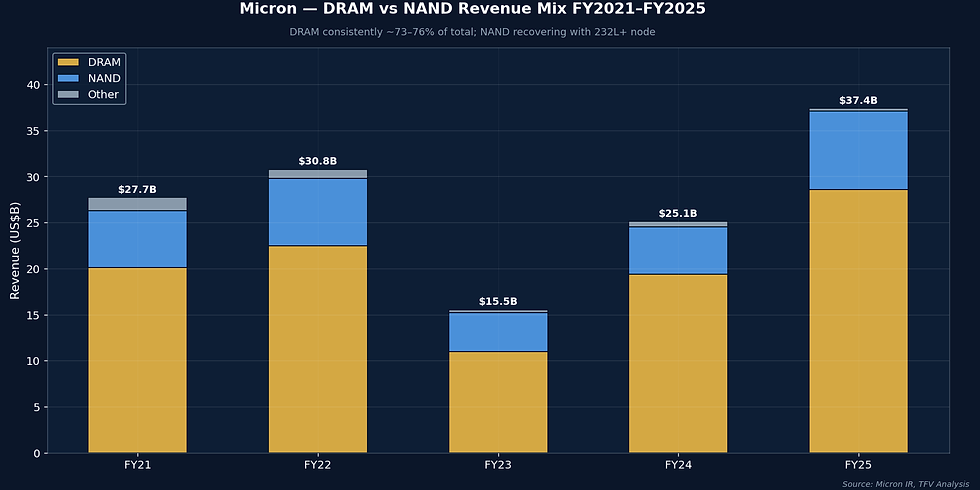
Micron Technology was founded in Boise, Idaho in 1978. The company reported USD 25.1 billion in FY2024 revenue, with FY2025 on track for USD 34-36 billion as HBM volumes accelerate. The business has two primary product families: DRAM (73% of revenue) and NAND Flash (24%).

DRAM is Micron's strategic crown jewel. It encompasses standard DDR5, LPDRAM for mobile and automotive, and High Bandwidth Memory (HBM) — the product reshaping the company's economics. NAND is manufactured at fabs in Singapore and Taiwan, targeting enterprise SSDs and client storage. The remaining 3% is NOR and specialty products.
The four commercial segments — Compute and Networking (CNBU), Mobile (MBU), Embedded (EBU), and Storage (SBU) — are increasingly dominated by CNBU, which houses HBM and server DRAM. CNBU carries the highest margins and is now the largest segment by revenue.

Manufacturing Footprint and CHIPS Act

Micron manufactures at fabs in Hiroshima (1-beta/1-gamma DRAM), Taiwan, Singapore (NAND), and Manassas. The transformational investment is the USD 50 billion greenfield fab campus in Clay, New York, anchored by a USD 6.1 billion CHIPS Act direct award — the largest under the program. First wafers in New York are targeted for 2028-2029.
III. Industry Structure
The global DRAM market is one of the most consolidated industries in semiconductors. Three companies — Samsung, SK Hynix, and Micron — control approximately 95% of global DRAM revenue. Samsung holds 40-45%, SK Hynix 30-35%, and Micron 22-26%. This structure has been stable for a decade, protected by extraordinary capital intensity and process complexity.

Within DRAM, HBM is a further-concentrated subset. Only Samsung, SK Hynix, and Micron produce HBM at commercial scale. YMTC, China's NAND champion, has made no credible progress toward HBM, and export controls on EUV tooling make a sub-3-year breakthrough essentially impossible.
NAND is more competitive: six vendors operate at scale including YMTC, whose access to advanced equipment has been substantially curtailed by US export controls since October 2022. YMTC cannot advance materially beyond 128-layer NAND while incumbents are at 232-layer. The enterprise NVMe SSD market — Micron's focus — remains beyond YMTC's reach.

Capital Intensity as the Moat
A single leading-edge DRAM fab costs USD 15-20 billion from greenfield to first wafer and takes 3-5 years to build. An ASML EUV scanner costs approximately USD 200 million per unit; a leading-edge DRAM fab requires dozens. No new entrant has broken into merchant DRAM in 25 years. For HBM, advanced packaging complexity adds another barrier that no China-based company can currently surmount.
IV. Moat Analysis
Standard DRAM is spot-priced and sold through distributors. HBM is sold under multi-quarter supply agreements directly negotiated with AI accelerator OEMs. NVIDIA designs Blackwell and Rubin architectures around specific HBM3E/HBM4 specifications, then sources on contract. This is a fundamentally different commercial dynamic — closer to aerospace components than commodity chips.

1-Gamma Node and the HBM4 Race
Micron claimed first-to-market on its 1-gamma DRAM process in early 2025 — the fourth generation of EUV-assisted DRAM, delivering approximately 15% cell-area improvement versus 1-beta. This translates to lower cost per bit and higher density per HBM stack. Micron qualified HBM3E for NVIDIA's H200 and GB200, and is sampling HBM4 (targeting 2TB/s bandwidth) for Rubin GPUs expected in 2026-2027.
The deepest moat in memory is yield learning — the accumulated recipe knowledge to produce a sub-15nm DRAM cell at greater than 90% functional yield. That knowledge, built over decades of factory operations, cannot be replicated by poaching engineers or reading patents. For HBM packaging specifically, the through-silicon via and interposer bonding yield learning compounds this advantage.
V. Management Quality
CEO Sanjay Mehrotra joined in 2017 after co-founding SanDisk (acquired by Western Digital for USD 19 billion). He holds over 70 patents and helped invent modern NAND flash. This is not a financier running a technology company — it is a technologist who understands the engineering trade-offs that determine whether Micron wins HBM4 Rubin allocation.
The most important management test in a cyclical business is behavior at the trough. In FY2023, Micron cut NAND wafer starts by approximately 35% to accelerate supply correction while sustaining DRAM technology investment and CHIPS Act commitments. This is the correct call: managers who cut capex at the trough cannot ramp HBM when NVIDIA needs it. Mehrotra did not.
One genuine weakness: Mehrotra is a methodical communicator who does not generate the investor narrative excitement of Lisa Su or Jensen Huang. This suppresses the multiple without impairing execution. EVP Scott DeBoer owns the 1-gamma process and HBM roadmap with two decades of Micron tenure.
VI. Financial Performance
Revenue: Cycle Recovery on Structural Rails
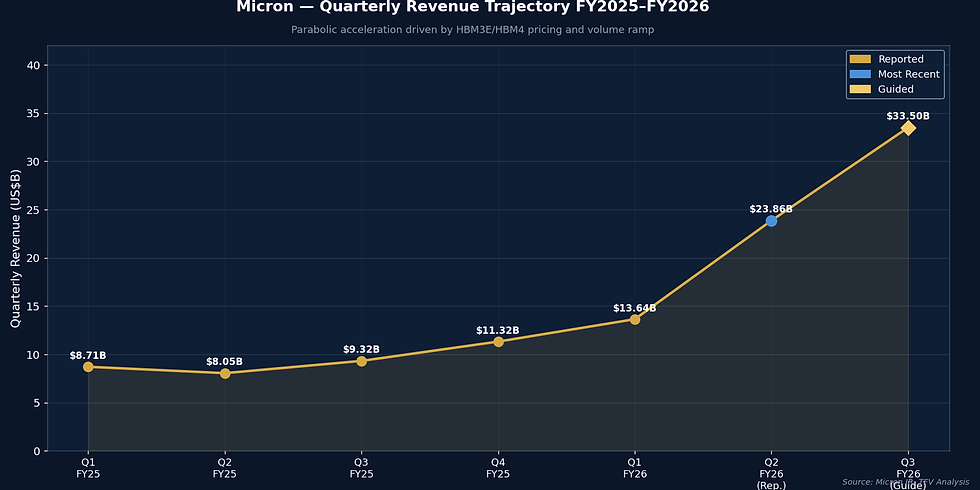
Micron's revenue swings define the memory cycle: FY2022 peaked at USD 30.8 billion, FY2023 collapsed to USD 15.5 billion (negative 49%), and FY2024 recovered to USD 25.1 billion. FY2025 consensus is approximately USD 35 billion with FY2026 estimates spanning USD 38-48 billion depending on HBM volume assumptions. The recovery velocity — over 60% year-over-year quarterly growth by late FY2024 — is driven entirely by AI infrastructure. The PC and smartphone channels provide zero tailwind.

Gross Margin: The HBM Mix Effect
Gross margins went from negative 23% at the FY2023 trough to approximately 22% for full-year FY2024, with the Q4 FY2024 exit rate above 30%. HBM3E gross margins are estimated at 40-55% versus standard DRAM at 15-25%. As HBM grows from 5-6% of DRAM revenue in FY2024 to an estimated 15-20% by FY2026, the mix shift alone drives 300-500 basis points of gross margin expansion — structurally, not cyclically.


Earnings and Free Cash Flow
EPS swung from negative USD 5.36 in FY2023 to positive USD 0.70 in FY2024, with FY2025 consensus at USD 8-9 per share. Net income moved from a USD 5.8 billion loss to an estimated USD 9-10 billion profit in FY2025 — one of the most dramatic two-year earnings reversals in semiconductor history.


Free cash flow tells the more complex story: capex at USD 8-10 billion annually consumes most operating cash flow during the build-out. However, CHIPS Act grants and the 25% investment tax credit on qualifying capex reduce effective cash cost by an estimated 30-40%. We model FCF of USD 5-8 billion in FY2026 and USD 10-15 billion in FY2027-2028 as New York fabs ramp.

VII. Balance Sheet Health
Micron entered FY2026 with USD 8.7 billion in cash and short-term investments against USD 13.4 billion in debt, for net debt of approximately USD 4.7 billion — modest relative to a USD 12+ billion EBITDA run-rate. Debt maturities have been extended to 2028-2032. No refinancing pressure exists.

Capex runs USD 8-10 billion annually through FY2027 — approximately 25-30% of projected revenue, comparable to SK Hynix on a proportional basis. After CHIPS Act grants and investment tax credits, effective cash capex is materially lower. Investors who use gross capex in FCF models are consistently underestimating Micron's cash generation through the investment cycle.
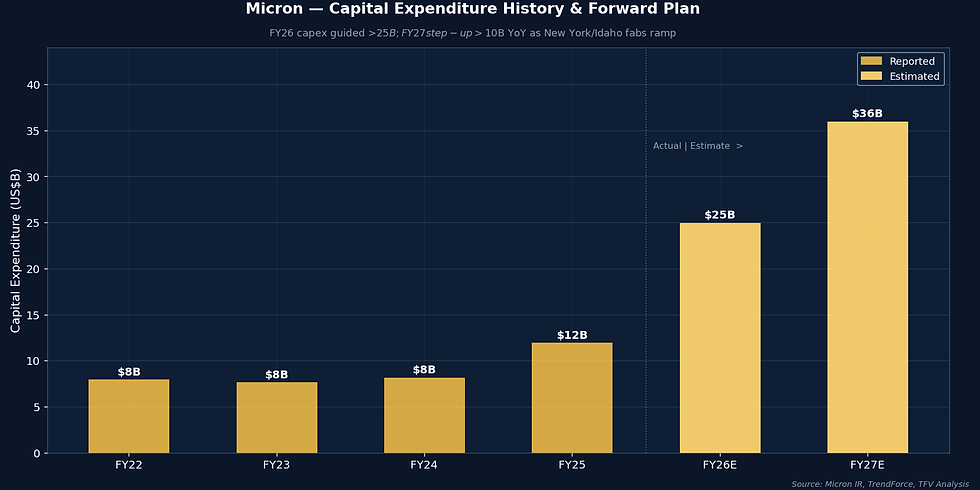
The USD 6.1 billion CHIPS Act award is not just financial — it confers quasi-strategic-asset status. The US national security community views Micron as the sole vehicle for domestic advanced memory capacity. This provides political protection from export controls that could impair overseas fabs and priority treatment in government procurement scenarios.
VIII. Growth Drivers
Driver 1: HBM Supercycle
A single NVIDIA H200 uses 141GB of HBM3E across 8 stacks. A Blackwell GB200 NVL72 rack uses approximately 1,350 HBM3E stacks at roughly USD 300 each — USD 400,000 of HBM per rack. At hyperscaler capex scales (NVIDIA revenue growing 50-70% annually), the pull-through for HBM is unprecedented in semiconductor history.

The HBM TAM is projected to grow from approximately USD 4 billion in 2023 to USD 16-20 billion by 2026, with a path to USD 40-60 billion by 2030. Micron's target is 20-25% share by FY2026. At USD 20 billion TAM and 22% share, Micron's HBM revenue alone reaches USD 4.4 billion — roughly 12% of projected total revenue.

Driver 2: Data Center DRAM Beyond HBM
Beyond HBM, every AI training and inference cluster requires substantial DDR5 for CPU memory pools, switch memory, storage controller DRAMs, and tens of thousands of CPU servers supporting the AI stack. IDC estimates data center DRAM demand growing at 30-40% CAGR through 2027 ex-HBM. Micron's data center share of DRAM segment revenue was approximately 50% in Q4 FY2024, rising toward 65% by FY2026.
Driver 3: PC/Mobile Refresh and NAND Recovery
AI-capable PCs require 16-32GB of LPDDR5 versus 8-16GB prior — a meaningful bit-demand increase per unit. Mobile AI flagship devices require 8-12GB LPDDR5X. These dynamics provide a pricing floor under standard DRAM. Enterprise NAND for AI training storage (checkpointing, dataset serving) drives NVMe SSD demand at margins similar to server DRAM. NAND pricing is still recovering from the 2023 trough and has meaningful upside.
IX. Risks and What Would Change Our Mind
Risk 1: Memory Cycle Reversal
The most consequential risk is an oversupply-driven pricing collapse. Memory pricing has historically fallen 50-70% peak-to-trough in 18 months. A scenario where Samsung breaks capacity discipline to capture HBM share while flooding the standard DRAM market would compress blended ASPs severely. Watch Samsung wafer start announcements relative to hyperscaler demand guidance.

We partially discount this risk. Samsung is fixing its own HBM yield issues and has structural incentives to maintain DRAM pricing while doing so. Meanwhile, Microsoft, Google, Meta, and Amazon have collectively guided to over USD 325 billion in combined capex for 2025 — providing enormous pull-through for every memory category.
Risk 2: HBM Share Loss to SK Hynix
SK Hynix holds approximately 50-55% of HBM today. If NVIDIA's Rubin allocation goes disproportionately to SK Hynix, Micron's share growth stalls. Our counter: hyperscalers and NVIDIA explicitly want supply diversification. Single-supplier dependence for HBM4 is a risk they will not accept. Micron's 1-gamma advantage creates a technical argument for incremental allocation.
Risk 3: CHIPS Act Execution
Greenfield fabs are complex. Samsung's Taylor, Texas facility has faced significant delays. If the New York fab timeline slips materially, the HBM4 domestic production thesis and CHIPS Act grant disbursements shift out, impacting our FCF model and technology roadmap assumptions.
Risk 4: Customer Concentration
Micron's HBM revenue is heavily concentrated in NVIDIA. A deceleration in GPU demand — from hyperscaler capex pullback, competing architecture, or tightened export controls cutting Chinese AI access — would be the mechanism by which our bear case (USD 450) is reached.
X. Valuation
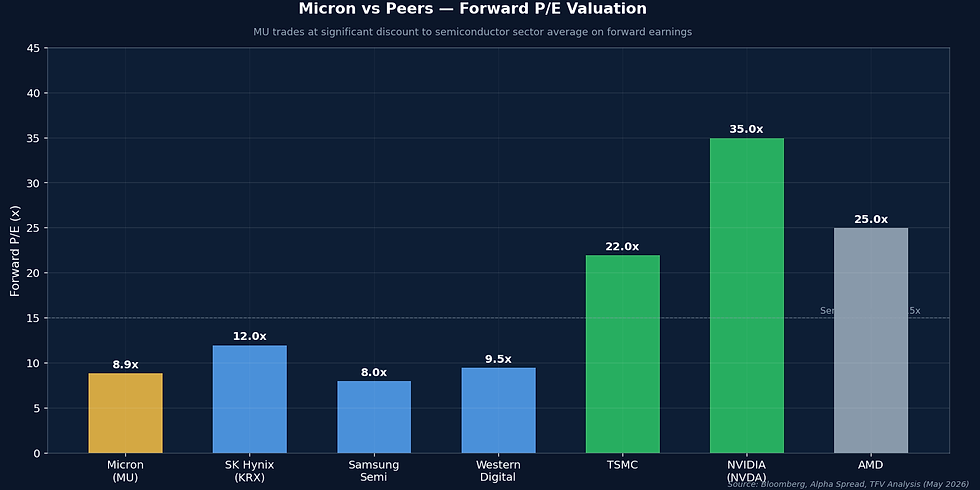
Micron trades at approximately 7-8x trailing earnings and 6-7x forward FY2026 at USD 643. The Nasdaq trades at 26x forward. The S&P 500 at 21x. Even within semiconductors, perceived cyclicals trade at 15-20x. The discount applied to Micron is extraordinary and reflects decades of investor conditioning around commodity memory cycles.
The re-rating case rests on three arguments: (1) A meaningful fraction of earnings now derives from contracted HBM revenue with genuine visibility. (2) Micron's cost structure is structurally improving via 1-gamma and CHIPS Act subsidies. (3) If USD 8-12 normalized EPS through the cycle is achievable — which we believe it is — a 15x multiple implies USD 120-180 per share at 15x... but the stock is USD 643 because the market is pricing much higher cycle-peak EPS. Our targets are based on FY2026-2027 EPS of USD 12-20 at 10-20x.

ROIC: The Through-Cycle Test
Micron's ROIC swung from deeply negative in FY2023 to an estimated 12-15% by FY2025. The critical question is whether ROIC can be sustained above the company's WACC of approximately 10-12% through the next trough. We believe yes — conditional on HBM maintaining above 15% of DRAM revenue. Below that threshold, the ROIC story reverts to historical cyclical patterns.

Scenario Analysis and Price Targets

Bull Case USD 1,100: HBM TAM reaches USD 45B by 2027, Micron at 25% share, HBM4 ASPs sustain at USD 350+/stack, gross margins at 45%, EPS USD 18-20, 20x applied to contracted-revenue-weighted earnings. Requires sustained NVIDIA/hyperscaler capex trajectory through 2027.
Base Case USD 720: HBM TAM USD 25B by 2026, Micron at 20% share, gross margins 38%, EPS USD 12 in FY2026, 10x multiple as contracted HBM earns a quality premium. Primary scenario, approximately 60% probability.
Bear Case USD 450: SK Hynix dominates Rubin allocation, commodity DRAM softens on Samsung capacity ramp, EPS settles at USD 6-7, 8x trough multiple. The structural thesis breaks; HBM share stalls at 12%. Approximately 25% probability.

XI. Market Expectations
Sell-side consensus applies approximately 7-8x forward P/E — essentially the same multiple it has applied at every prior cycle peak. The dominant bearish argument is historically valid: memory cycles always revert, and Micron's current earnings composition will deteriorate. We acknowledge the historical validity and reject its forward application because HBM contractual revenues represent a structurally different earnings composition than any prior cycle.

We are more bullish than consensus on three points: Micron achieving 20%+ HBM share by FY2026 (vs. consensus cap of ~15%); sustainable gross margin of 38% vs. consensus ~32% (we model contracted HBM pricing, not commoditization); and a 10x multiple vs. consensus 7-8x on the argument that contracted HBM revenue earns a quality premium. Where consensus is right to be cautious: customer concentration in NVIDIA and cycle timing uncertainty are genuine risks.
XII. Final Verdict
Micron Technology is a BUY at current prices. The market applies a commodity multiple to a company whose most important product is not a commodity. HBM demand is locked in by hyperscaler capex commitments in the tens of billions per company. Supply is locked by 3-5 year fab timelines and extraordinary process complexity. In that environment, pricing power is real, durable, and not yet reflected in the multiple.
We hold 30 shares at USD 510.48 average cost. At USD 643, the position shows 25.9% unrealized gain. We are not selling. The trailing stop sits at USD 560 — locking meaningful profit while allowing the thesis to run through the NVIDIA Rubin cycle in 2026-2027. On a pullback to USD 580-600, we would add.
Position Parameters
Entry: USD 510.48 avg (30 shares)
Current: USD 643 (May 2026)
Stop: USD 560 trailing — locks 9.7% gain from cost
Base Target: USD 720 (+12% from current)
Bull Target: USD 1,100 (+71% from current)
Horizon: 12-18 months through NVIDIA Rubin cycle
Key Catalyst: MU FQ3 earnings late June 2026 — HBM4 ramp commentary is the single most important data point
What We Are Watching
Four data points would force us to revise: (1) NVIDIA Rubin HBM content per GPU below Blackwell; (2) Samsung announcing unscheduled DRAM capacity ramp targeting HBM markets; (3) Micron FQ3 2026 gross margins below 34%; (4) US export control expansion restricting Micron's Taiwan and Japan fabs from serving non-Chinese customers. None of these are currently materializing.
This research is for educational purposes only. The Financial View operates a virtual USD 100,000 portfolio on Investopedia for educational tracking. Nothing in this report constitutes investment advice or a solicitation of any investment decision. All data sourced from public company filings, earnings transcripts, and analyst research as of May 2026.
Educational content. Virtual USD 100K portfolio. Not investment advice.


