Europe's Reckoning: Migration, Debt, and the Slow Fracture of the EU Economy
Preface: What This Report Is — And Isn't
This is not a report about whether Europe is collapsing. It isn't. But it is a report about a continent that has been living off structural advantages built in the postwar era — open markets, cheap Russian energy, American security guarantees, and a demographic dividend that has now fully expired — and which is running out of time to replace them.
Migration is the most politically charged variable in this story, but it is not the only one. The structural rot predates the 2015 refugee wave by decades. What mass migration did was accelerate fiscal and social pressures that were already building: from aging demographics, from energy dependence, from industrial hollowing-out, and from a technology gap that Europe has consistently failed to close. Neither side of the political debate is telling the full story. The right attributes everything to migration. The left attributes nothing to it. The data supports neither position.
What follows is an attempt to quantify what the headlines won't: what migration actually costs, what it contributes, what the structural problems are that exist regardless of migration, and what the realistic scenarios look like going forward. Every figure cited has a primary source. Where data is contested or methodology-dependent, that is flagged explicitly.
This is a long report. It is meant to be read in full.
Part 1 — The EU Economy: The Macro Dashboard
1.1 The Divergence
The single most important number in European macroeconomics over the past decade is this: since 2015, the United States has grown its real GDP by roughly 30%. The eurozone has grown by roughly 15%. China, despite a significant slowdown from its earlier pace, has more than doubled. Europe didn't just get lapped — it got lapped by an economy it used to benchmark itself against and an economy it used to dismiss as a manufacturing floor.

The divergence is not a pandemic artifact. It was present before COVID-19 and it reasserted itself after. In 2023, the eurozone grew at just 0.6% — the same rate the United States grew in a year when the Fed had rates at 5.25–5.50% and everyone was expecting a recession that never came. In 2024, the eurozone managed 0.9%. Germany, the bloc's anchor economy, contracted for the second consecutive year.
The causes are structural, not cyclical. They will not be fixed by a rate cut.
1.2 The Productivity Gap
Output per hour worked — the truest measure of an economy's productive efficiency — tells a damning story. The United States produces roughly $87 per hour worked in PPP terms. The eurozone produces roughly $70. That 20% gap has been widening, not closing, for two decades.
The Banque de France, in a 2024 analysis, put the gap starkly: on a GDP-per-hour basis (US = 100), Germany sits at 90, France at 86, Italy at 72. The common response from European economists is that Europeans simply choose to work fewer hours — that the gap reflects preference, not failure. This is partially true. But it doesn't explain why the gap is widening. Europeans are producing less per hour worked relative to Americans than they were in 2000.
The Draghi Report — published in September 2024 and arguably the most important economic document written about Europe in a generation — locates the cause precisely: the productivity gap between Europe and the US is largely explained by the tech sector. Strip out technology, and Europe's productivity growth over 20 years would be broadly at par with the US. The problem is that Europe has essentially no technology sector of global consequence, and the gap is getting worse.
1.3 The Debt Arithmetic
Europe's fiscal position varies enormously across member states, and the variation matters enormously for what any individual country can actually do about its structural problems.

Greece at 146% of GDP has essentially no room to manoeuvre. Every percentage point of additional debt costs Greece more than it costs Germany because markets price in default risk. Italy at 137% is in a structurally similar position — its 2023 budget deficit reached 7.4% of GDP due to the Superbonus housing credit scheme, triggering an EU Excessive Deficit Procedure. France at 115.6% is the most alarming of the major economies because it is the only one where debt is still rising rapidly, with the deficit projected to widen further to 5.7% of GDP by 2027.
Germany at roughly 63% is the outlier — the one major economy with meaningful fiscal headroom. But Germany just spent two consecutive years in economic contraction, and its political system is in the middle of a fracture that is making structural reform increasingly difficult to pass. The EU's Stability and Growth Pact requires deficits below 3% and debt below 60%. Seven of the bloc's largest economies currently violate at least one of those rules. The pact has essentially become advisory.
1.4 The ECB's Impossible Mandate
The European Central Bank operates under a constraint no other major central bank faces: it must set a single interest rate for 20 economies with radically different fiscal positions, debt levels, inflation dynamics, and growth trajectories. When the ECB tightened aggressively in 2022–2023 — raising the deposit rate from -0.50% to 4.00% in 14 months — it did so because eurozone headline inflation hit 10.6% in October 2022. But that same rate increase was applied to Italy, Greece, and Portugal equally as it was to Germany and the Netherlands.
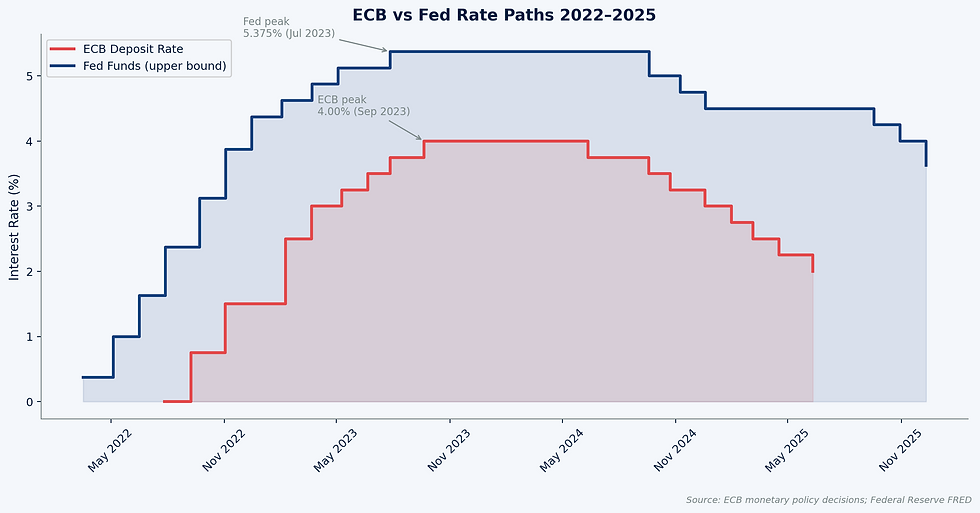
The ECB peaked at 4.00% in September 2023 — 125 to 150 basis points below the Fed's peak of 5.375%. It began cutting in June 2024 and reached 2.00% by June 2025, even as the Fed held higher for longer. By end-2025, the spread between Fed funds and ECB deposit rate was approximately 150–175 basis points. This divergence has consequences: a weaker euro makes European exports more competitive but also makes energy imports — still priced in dollars — more expensive, compounding the energy cost problem.
The deeper issue is that the ECB cannot fix a solvency problem with monetary policy. Countries that need fiscal consolidation cannot be rescued by rate cuts. The eurozone's design creates a permanent tension: member states retain fiscal independence but share monetary policy, which means profligate governments can effectively export part of the cost of their borrowing to the rest of the bloc through the common currency.
1.5 The Energy Shock That Won't Reverse
The destruction of the Nord Stream pipeline in September 2022 did not just cut off cheap Russian gas to Germany. It permanently repriced European industrial competitiveness. The energy cost differential that resulted is not a temporary disruption — it is the new baseline.

In 2024, German industrial electricity prices averaged €233 per MWh. American industrial electricity averaged roughly €75 per MWh. Chinese industrial electricity averaged roughly €82 per MWh. Germany pays approximately three times what American manufacturers pay to run the same production line.
For energy-intensive industries — chemicals, steel, aluminium, cement, glass, paper — this differential is not survivable long-term. BASF has invested over $1 billion in its Geismar, Louisiana facility under the US Inflation Reduction Act. VW-backed Scout Motors committed $2 billion to a South Carolina EV plant. BMW invested $1.7 billion in South Carolina. These are not temporary hedges. They are structural relocations driven by a permanent energy cost reality. The IEA confirms that EU industrial prices remain roughly 2× US levels and approximately 50% above China even after the 2022–2023 spike subsided.
1.6 Manufacturing Decline: Germany's Export Model Breaks Down

Germany's postwar economic model was built on three pillars: cheap Russian energy, high-quality engineering exports, and Chinese consumer demand. All three have deteriorated simultaneously. Russian energy is gone. China's domestic auto industry — BYD, Geely, SAIC — now competes directly against German brands in China and in third markets. And German engineering, while still world-class, is embedded in supply chains optimised for a cost structure that no longer exists.
German GDP contracted 0.3% in 2023 and 0.2% in 2024 — the first back-to-back annual contractions since the early 2000s. Overall industrial production fell 4.5% in 2024 alone. Energy-intensive sectors are down roughly 27% from their 2019 level by 2025.
1.7 The Digital Economy Gap
Europe has essentially no globally dominant technology company. The Draghi Report made this point with particular force: of the world's top 50 technology companies by market capitalisation, only four are European. No European company with a market capitalisation above €100 billion has been founded in the last 50 years. Every US company currently valued above $1 trillion was founded in this period.
The Magnificent Seven US tech companies had a combined market capitalisation of roughly $20.8 trillion in late 2025 — a figure that exceeds the entire GDP of the European Union. Stanford's AI Index 2025 reports that US private AI investment in 2024 was $109.1 billion. Europe's entire AI investment over the decade 2013–2024 was roughly $50 billion — less than the US spent in a single year. Europe produced three notable AI models in 2024. The US produced 40.
Part 2 — Migration: The Full Ledger
2.1 The Flows
To understand the fiscal and social impact of migration, you first need to understand what actually happened. The numbers are large and they are frequently misrepresented in both directions.

In 2015, the EU received approximately 1.26 million first-time asylum applications. Germany alone received 441,800 in 2015, then 722,300 in 2016 as the backlog was processed. Sweden, with a population of 9.8 million, received 162,877 applications — roughly 1,600 per 100,000 people, making it the most exposed country in Western Europe on a per-capita basis.
Then came Ukraine. Russia's full-scale invasion in February 2022 triggered the largest displacement of people in Europe since World War II. By late 2025, approximately 4.3 million Ukrainians held temporary protection status in the EU — 28% in Germany, 23% in Poland. Total EU net migration hit roughly 4 million in 2022. It has since moderated to approximately 2.3 million in 2024.
The migrant flows are not homogeneous. Ukrainian temporary protection holders are predominantly women and children, educated, and integrated into the workforce at rates significantly higher than Middle Eastern and African refugee cohorts. The fiscal and social calculus for each group is fundamentally different, and any analysis that aggregates them is analytically useless.
2.2 The Cost Side
Germany's federal government has spent more than €20 billion per year on migration-related expenditure every year since 2016. This is not a contested claim — it comes directly from the Bundesfinanzministerium. In 2023, that figure peaked at €29.7 billion, representing 6.4% of the federal budget.

Sweden's migration costs are harder to pin down precisely, but University of Gothenburg economist Joakim Ruist estimated refugee immigration's net fiscal cost at approximately 1.35% of GDP annually at the 2015 peak — corresponding to roughly SEK 60–70 billion annually, driven primarily by the employment gap between refugee-origin migrants and native Swedes.
France's integration spending in its banlieues is genuinely difficult to quantify. The Cour des Comptes has estimated state spending on urban policy targeting deprived areas at roughly €10 billion per year. The IFRAP think-tank puts the cumulative figure since 2010 at €117 billion. The honest answer is that France has spent enormous sums on integration over decades and has, by most measurable metrics, failed to achieve it.
2.3 The Contribution Side
The costs above are real. So are the contributions — and they are systematically under-reported in political debate.
IW Köln calculated that foreign employees contributed €536 billion directly to German GDP in 2024 — roughly 13.7% of total output. The German care sector, construction industry, agriculture, and logistics would not function at current capacity without migrant labour. In an economy with record-low unemployment among native workers and a shrinking working-age population, migrants are filling gaps the native workforce cannot fill.
The most rigorous recent study of migrants' net fiscal contribution in Germany (Sallam and Christl, 2024) gives a nuanced picture: EU citizens working in Germany contribute +€3,175 per year net. German nationals average +€629. Non-EU citizens average -€2,633 per year. The aggregate net contribution of all foreigners is approximately -€2.5 billion — roughly -0.07% of GDP. Migration is neither the fiscal catastrophe the right claims nor the fiscal windfall the left claims. At current integration rates, it is a modest net cost, with large variation by origin group.
The critical variable is integration. A migrant who enters the labour market within two years and pays taxes and contributions for 40 years is a net fiscal positive. A migrant who remains outside the labour market for a decade is a net fiscal negative. The integration data is where the honest reckoning lives.
2.4 The Integration Failure
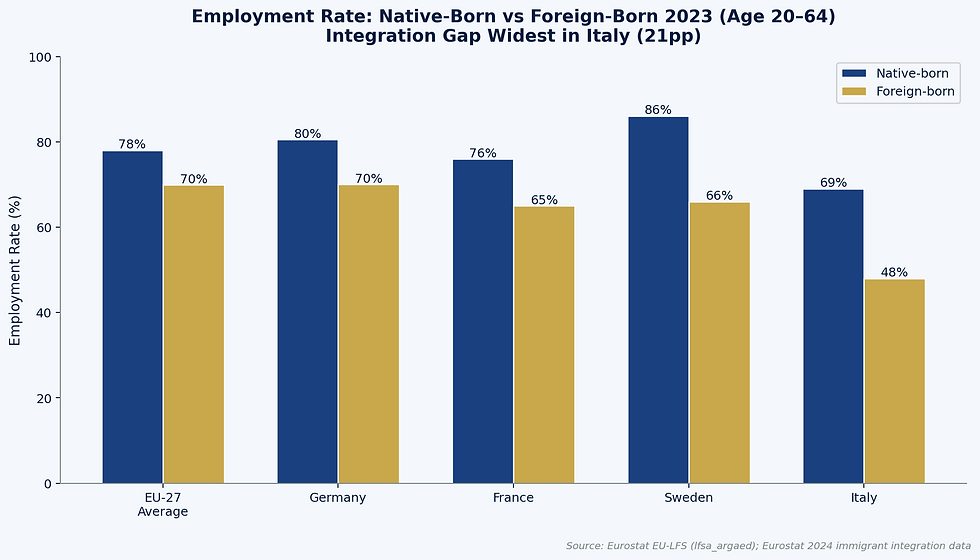
EU-wide employment rate for native-born workers aged 20–64: 78%. For foreign-born workers: 69.9%. The 8 percentage point gap understates the problem because the foreign-born cohort includes many EU citizens — Poles in Germany, Romanians in Italy — who integrate quickly. The gap for non-EU citizens is far larger.
In Italy, the employment gap between native-born and foreign-born workers is 21 percentage points — the widest in the EU. In Sweden, female non-EU citizens have employment rates more than 45 percentage points below female nationals in some regions. MENA-origin refugees in Sweden show employment rates of 40–44% after five years in country, rising to 50–60% after a decade for men. Somali-origin refugees plateau at roughly 26% long-term. Afghan women: approximately 12%.
Second-generation outcomes — the children of migrants — are the most important and most under-reported data set. Native-born children with two foreign-born parents have employment rates approximately 8–10 percentage points below those with two native parents. The gap is narrowing, but not fast enough to offset the fiscal drag of the first generation's integration failure.
The long-term unemployment rate among non-EU citizens is roughly 2.5 times the rate for EU nationals. Over-qualification rates among foreign-born workers reach 64% in Italy and 56% in Spain. A Syrian doctor working as a cleaner is counted as employed but is contributing a fraction of his productive potential. The integration failure is not just a social cost — it is an enormous economic waste.
2.5 The Crime Statistics: The Honest Analysis
This is the section every serious analyst of European migration dreads writing, because the data exists, it is meaningful, it is contested, and it is routinely weaponised. The approach here is to present what official statistical agencies actually say and to flag the methodological limits clearly.
Germany's Federal Criminal Police Office reported in its 2024 Polizeiliche Kriminalstatistik that non-German citizens represented 41.8% of all crime suspects — or 35.4% excluding immigration-specific offences that only non-citizens can commit — despite being approximately 15% of the population. Violent crime reached its highest level since 2007.
Sweden's National Council for Crime Prevention (Brå), in its landmark 2021 register study covering 2007–2018, found that foreign-born individuals had 2.5 times the relative risk of being suspected of a crime compared to native-born individuals with two native parents. After adjusting for age, sex, income, education, and urban density, that overrisk falls to 1.7–1.8 times — statistically significant but substantially reduced.
Three caveats are essential. First, the German data counts police investigations, not convictions, and includes offences only foreigners can commit. Second, the Brå study measures suspects, not convicted persons, and criminologists note potential over-policing bias. Third — and most importantly — both datasets reflect a clear socioeconomic confound: young men with low income, low education, and high urban density are over-represented in crime data regardless of origin. Controlling for these factors substantially reduces the overrisk, though does not eliminate it.
What the data supports is not a conclusion about inherent predisposition. It supports a conclusion about integration failure. The Swedish government's own reports on gang crime explicitly link the surge in organised violence to specific migrant cohorts who arrived with no viable path to legitimate employment. The diagnosis is exclusion, not origin. Integration failure is addressable. That is the policy implication that actually matters.
Part 3 — Germany: The Sick Man of Europe
3.1 Two Years of Contraction
Germany's GDP contracted 0.3% in 2023 and 0.2% in 2024. In the context of Germany's history, this is the first back-to-back annual contraction since the early 2000s post-reunification adjustment. More important than the headline is the composition of the decline: gross fixed capital formation fell 2.8% in 2024, residential construction declined for the fourth straight year, and export volumes fell as German products lost competitiveness in their key markets. The government's 2025 growth forecast was cut from 1.1% to 0.3%. Germany is not in a cyclical downturn. It is in a structural adjustment that has no obvious near-term resolution.
3.2 The Automotive Sector: An Industry at the Edge
In September 2024, Volkswagen announced — for the first time in its 88-year history — that German factory closures were under consideration. By December, the deal with IG Metall was complete: 35,000 jobs cut, capacity reduced by 734,000 vehicles annually, targeted savings of €15 billion. The Dresden Gläserne Manufaktur ceased vehicle production in December 2025 — VW's first actual German plant closure in its history.
Mercedes-Benz's automotive division saw its adjusted return on sales collapse from 14.6% in 2022 to 8.1% in 2024. BMW's automotive EBIT margin fell from 9.8% in 2023 to 6.3% in 2024. The EV transition is exposing a cost structure that was always fragile: German auto labour costs run €59–62 per hour versus €33 in Italy and €29 in Spain. Chinese competitors produce vehicles at a structural cost advantage that German manufacturers cannot close through efficiency alone.
3.3 Political Fracture
The 2025 federal election produced the AfD's best-ever result: 20.8% of the national vote, doubling its 2021 share and finishing second nationally. In eastern Germany — Saxony, Thuringia, Saxony-Anhalt — AfD support ranges from 39% to 42% in current polling. At the national level, polling in May 2026 puts AfD at 27–29%, making it Germany's leading party.

The AfD's rise is directly traceable to the decisions of 2015–2016. Angela Merkel's opening of German borders to over one million asylum seekers in a single year was the founding event of AfD's mass electoral appeal. The party existed before 2015 as a eurosceptic protest vehicle. The migration crisis transformed it into a mass movement. Its 33%+ blocking minority in several eastern state parliaments means it can veto constitutional amendments and certain budget decisions — making structural reform increasingly difficult to assemble.
3.4 Infrastructure: The Backlog
Deutsche Bahn's long-distance train punctuality rate fell to 60.1% in 2025 — a new record low, with October 2025 hitting 51.5% in a single month. DB attributes 80% of delays to ageing, overloaded infrastructure. The actual backlog stood at approximately €143 billion as of DB InfraGO's May 2026 status report. The federal government has committed €107 billion for rail maintenance through 2029 — which covers the rail portion but not stations, and requires sustained political will to execute.
Part 4 — Sweden: The Most Instructive Case Study
Sweden matters more than its size would suggest because it ran the most ambitious migration experiment in Western Europe — and because it is now reversing course more explicitly than any comparable country, giving us data on what reversal looks like in practice.
4.1 The Scale of the Experiment
Sweden took more asylum seekers per capita in 2015 than any Western European economy. Its 162,877 applications represented 1,600 per 100,000 people. Over a 30-year period prior to 2015, Sweden accepted refugees at roughly 10 times the European average on a per-capita basis. The 2015 wave was not an aberration — it was the culmination of a genuinely open policy stretching back decades.
4.2 The Integration Record
Sweden's own government has documented the integration failure more thoroughly than most. Employment rates among MENA-origin male refugees range from 40–44% in the first five years, rising to 50–60% after a decade. For women from Afghanistan and Somalia, the figures are far lower — 12% and 13% respectively. Joakim Ruist's work puts the net annual fiscal cost of the refugee programme at roughly SEK 74,000 per refugee per year over a lifetime horizon, driven almost entirely by the employment gap.
Sweden's gun homicide rate — approximately 4 per million population annually — is more than double the Western European average of roughly 1.6 per million. Shootings peaked at 391 in 2022. Fatal shootings peaked at 62–63 the same year. The Brå data on gang crime is Swedish government data, not right-wing advocacy — and it has been weaponised extensively by the Sweden Democrats and their international allies.

The important corrective: lethal violence in Sweden fell to 92 deaths in 2024 — the lowest since 2014 and a 24% decline year-on-year. Shootings fell 18% from their 2022 peak. The gang violence problem that Sweden built up over a decade appears to have peaked, though the level remains elevated by European standards.
4.3 The Policy Reversal
Sweden's 2022 election brought a right-wing coalition to power, propped up by the Sweden Democrats at 20.5% of the vote. The resulting Tidöavtalet represents the most explicit reversal of an open migration policy in Western European democratic history. Key measures: asylum reduced to EU minimum standards; stricter family reunification; active deportation programme; security zones giving police stop-and-search powers. As of January 2026, Sweden increased its repatriation grant to SEK 350,000 per adult — a figure so large that the government's own appointed investigator publicly recommended against it on grounds that evidence for large grants increasing voluntary departure is weak.
What Sweden's reversal demonstrates is that it is politically possible to reverse open migration policy in a stable democracy. It does not demonstrate that the social costs of the integration failure disappear when you close the door. The gang infrastructure built during the open-door era does not dismantle itself because the policy changed.
Part 5 — France and Italy: Southern Pressure
5.1 France: The Fiscal Cliff Approaches
France's fiscal position is the most alarming among the major EU economies — not because its debt level is the highest, but because it is the one heading in the wrong direction fastest. Debt-to-GDP reached 115.6% at end-2025 and is forecast to exceed 120% by 2027. The deficit was 5.8% of GDP in 2024, triggering an EU Excessive Deficit Procedure. The European Commission's forecast shows the deficit widening to 5.7% by 2027 — in the opposite direction from what the EDP requires.
The pension reform of 2023 — raising the retirement age from 62 to 64, a modest change by European standards — required Prime Minister Borne to invoke Article 49.3 to force passage without a vote. It survived no-confidence motions by nine votes, then was voted to be suspended by parliament in November 2025. France cannot balance its books without pension reform. France cannot pass pension reform. That is the essence of its political-economic trap.
Marine Le Pen's trajectory — 21.3% in the 2017 presidential first round, 41.5% in the 2022 runoff — is the electoral expression of this trap. Le Pen was convicted of embezzlement and barred from public office in March 2025. Her replacement, Jordan Bardella, polls at 35–37.5% — higher than Le Pen ever achieved at a comparable pre-election stage. The 2027 French presidential election is genuinely competitive for the Rassemblement National.
5.2 The Banlieues: 50 Years of Failure
France's banlieues are not primarily a migration problem. They are primarily a legacy problem — the consequence of housing policy decisions made in the 1960s and 1970s that concentrated low-income North African labour immigration in suburban tower blocks with inadequate services, transport, and economic integration. The French state has spent approximately €10 billion per year on urban policy targeting these areas, with cumulative spending since 2010 estimated at €117 billion. The employment rate in these zones remains roughly 2.7 times the national unemployment rate. The Cour des Comptes has repeatedly found this spending lacks clear outcome measurement and is poorly targeted. France knows the policy is failing. It keeps doing it.
5.3 Italy: Demographics Are the Real Crisis
Italy processes more first-arrival migrants than any other EU state — irregular sea arrivals peaked at 157,651 in 2023, then fell sharply to 66,317 in 2024 after the Meloni government's deal with Tunisia. The immigration debate dominates Italian politics. It is not Italy's most serious problem.

Italy's most serious problem is that it is disappearing as a population. The total fertility rate hit 1.18 in 2024 — an all-time national record low. Total Italian births numbered 369,944 — the lowest since records began in 1861, and the 16th consecutive year of decline. Italy spends approximately 16% of GDP on pensions — the highest in the EU. Its pension contribution revenues cover only about 11% of GDP, leaving a gap of roughly 4–5 percentage points financed from general taxation. As the working-age population shrinks and the retired population grows, this gap widens automatically.
The North-South divide compounds everything. Lombardy's GDP per capita is €49,100. Calabria's is €21,000 — less than half. Lombardy alone generates more GDP than the entire Mezzogiorno. Migration flows into the South where the reception system is centred, but the economy that can absorb migrants is in the North.
Part 6 — The UK: Post-Brexit Verdict
6.1 The Scorecard
Six years after the Brexit transition, a reasonably honest assessment is possible: worse than Remain campaigners claimed before the vote, better than the most dire predictions, and with distributional effects that were almost the opposite of what Leave voters were promised.
On GDP: the UK grew at roughly the same rate as the eurozone in 2023 and 2024. The OBR's central estimate remains that Brexit reduces UK long-run productivity by roughly 4% relative to remaining in the EU. UK GDP per capita has fallen since 2022. On trade: UK goods exports to the EU in 2024 were £177 billion — below pre-Brexit nominal levels in a period of high inflation, meaning a sharp real-terms decline. On financial services: EY's Brexit Tracker found over 7,000 finance jobs moved from London to EU centres, with Paris, Frankfurt, and Dublin as the primary beneficiaries. Approximately £1.3 trillion in assets relocated.
6.2 The Migration Paradox
The primary Leave argument was reducing immigration. The data is unambiguous: it failed. Net migration to the UK peaked at approximately 944,000 in the year to March 2023 — a figure that would have been considered fantastical in 2016. What happened is exactly what economists predicted: EU nationals were replaced by non-EU nationals, primarily from South Asia, Nigeria, Zimbabwe, and via the Hong Kong BN(O) route.

EU net migration has been negative since 2021. Non-EU net migration peaked at over 1 million in the year to March 2023. Brexit did not reduce immigration. It changed where immigrants came from — in a direction that, by the revealed preference of Leave voters, was not what they wanted. Net migration has since fallen to approximately 171,000 in 2025 under tighter Labour government visa rules, but whether this is sustainable given the care sector's vacancy crisis remains unclear.
Part 7 — Structural Factors Beyond Migration
7.1 The Demographic Cliff
Migration was supposed to be Europe's answer to demographic decline. At current integration rates, it is not working at the scale required. The EU's old-age dependency ratio was 34.5% in 2025. The European Commission's 2024 Ageing Report projects it reaching 55% by 2050. Germany's central scenario reaches approximately 1.8 workers per retiree by mid-century. Italy reaches approximately 1.5 workers per retiree by 2050 — a ratio that makes the current pension system mathematically insolvent without major reform.
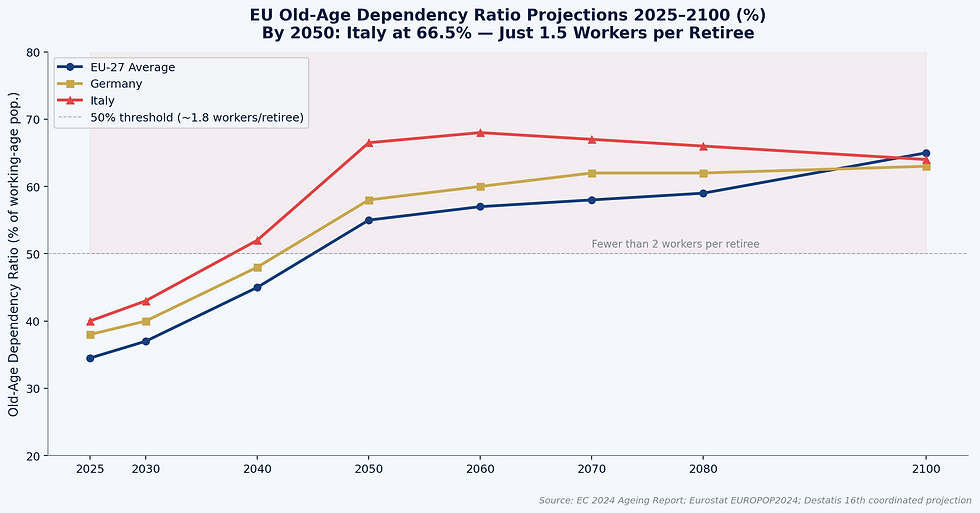
A shrinking working-age population means lower tax revenues, higher pension costs, higher healthcare costs, and less capacity to service debt — simultaneously, automatically, and without any policy failure required. It is a headwind that migration can partially offset but cannot eliminate at any realistic intake level given current integration rates.
7.2 The Green Transition Cost
The EU's net-zero agenda is real and expensive. The problem is not the goal — decarbonisation is necessary. The problem is the competitive context. The US Inflation Reduction Act has made America a more attractive destination for clean energy investment than Europe through direct subsidies that European state aid rules make difficult to replicate. Two-thirds of planned EU battery gigafactory projects are estimated to be at risk of delay or cancellation. Northvolt, Sweden's flagship battery maker and Europe's great clean energy hope, filed for Chapter 11 bankruptcy in November 2024 despite €902 million in German state aid specifically structured to prevent its relocation to North America.
Europe is paying for decarbonisation and losing industrial capacity simultaneously. The green transition was supposed to create new export industries. Instead, it is accelerating the relocation of energy-intensive production to jurisdictions where decarbonisation is someone else's problem.
7.3 The Regulatory Burden
GDPR, the Digital Services Act, the Digital Markets Act, the AI Act — Europe has regulated the digital economy more comprehensively than any other major jurisdiction. Cumulative GDPR fines have reached €6.11 billion since 2018. European companies spend an estimated €16 billion annually on GDPR compliance alone. NBER research found that GDPR reduced EU venture capital investment by 26%.
The Draghi Report describes this with unusual candour: Europe's regulatory reflex may be protecting consumers while ceding the productivity gains of the AI era to American and Chinese firms. GDPR is good for privacy. The question is whether the cost — borne primarily by European businesses and startups — is worth the benefit, which accrues primarily to European users. The data on AI investment suggests the competitive cost is substantial.
7.4 Capital Flight
European institutional capital continues to flow into US equities at record rates. European investors hold an estimated $7–9 trillion in US stocks. The EU capital markets union — announced in 2015, still incomplete a decade later — was supposed to address the fragmentation that makes it easier to raise capital in New York than in Frankfurt. It hasn't. European companies raising large-scale capital still typically choose to list in New York. The stock market, more than any other single indicator, reflects where the world's capital thinks growth will come from. It does not currently think the answer is Europe.
Part 8 — The Overall Verdict
8.1 What Migration Actually Explains — And What It Doesn't
The structural rot in the European economy predates the refugee wave. Germany's energy dependency on Russia was not created by Syrian asylum seekers. Europe's technology gap was not created by Afghans applying for asylum in Sweden. Italy's fertility collapse began in the 1970s. France's banlieue problem dates to the 1960s. The EU's capital markets fragmentation, its regulatory overreach, its pension arithmetic — none of these are migrant-caused.
What migration did was accelerate and politicise pre-existing pressures. The fiscal cost of integrating large numbers of low-educated, low-employed refugees lands on welfare systems already strained by ageing demographics. The social cost of integration failure lands on communities already anxious about economic stagnation. And the political cost — AfD at 27%, RN leading in France, Sweden Democrats in government, Meloni in Italy — is the electoral expression of those anxieties being mobilised by parties that offer simple narratives for complex problems.
The right is wrong to claim migration caused the structural problems. The left is wrong to claim migration has had no material costs. The truth — large fiscal costs concentrated in specific years and countries, combined with real but overstated social costs, against a background of structural economic failure that would exist regardless — is more complicated than either side will acknowledge.
8.2 Three Scenarios
The bear case requires no great leap: Germany stagnates for a decade, France reaches a fiscal crisis around 2028–2030 as debt service costs crowd out other spending, political fragmentation makes EU-level coordination impossible, and migration becomes the permanent scapegoat for structural failures that predate it. This is not the most likely outcome, but the conditions for it exist right now.
The base case: the ECB holds the monetary union together through another stress episode, Germany undergoes painful but not catastrophic industrial restructuring over 5–7 years, migration policy tightens across the bloc, and demographic pressure is managed but not solved. Slow growth, not collapse. A smaller, older, less dynamic Europe that remains wealthy by global standards but gradually loses relative weight in the world economy.
The bull case requires the AI productivity boom to translate into European output gains faster than demographic decline reduces the workforce — and the green transition to create new export sectors that compensate for lost manufacturing. It requires second-generation migrant integration to improve substantially on first-generation outcomes, and the political centre to hold. All of these things are possible. None of them are probable in the short term.
8.3 Five Indicators to Watch
German industrial output: if it stabilises and recovers by 2027, the base case holds. If it continues declining, the bear case becomes more likely.
French deficit trajectory: if France achieves meaningful fiscal consolidation by 2027, the fiscal cliff recedes. If the deficit widens to 5.7% as projected, France becomes the EU's most serious near-term risk.
ECB rate path vs Fed divergence: a euro significantly weaker than parity would signal markets losing confidence in European monetary management. A return toward 1.10–1.20 would signal the opposite.
EU migration pact implementation: the 2024 EU Migration and Asylum Pact promised burden-sharing across member states. If it remains unimplemented — as most EU migration commitments have — it signals that the political will for EU-level solutions has collapsed.
Second-generation employment rates in Germany and France: this is the long game. If the children of the 2015–2016 cohort enter the labour market at rates approaching the native-born baseline, the fiscal arithmetic improves substantially over a 20-year horizon. If they replicate their parents' exclusion, the cost compounds.
Data Sources and Methodology
All figures in this report are sourced from primary statistical agencies: Eurostat, Destatis, INSEE, ISTAT, ONS, SCB, China NBS, BEA, EIA, BLS, and the ECB. Crime data is sourced exclusively from BKA (Germany) and Brå (Sweden). Migration data is from Eurostat and national migration agencies. Electoral data is from official election authorities. Fiscal projections are from the European Commission's Spring 2026 Economic Forecast and the OECD Pensions at a Glance 2025. The Draghi Report (September 2024) is cited for competitiveness analysis. Contested figures are identified as such throughout.
The Financial View publishes institutional-grade financial analysis. Nothing in this report constitutes investment advice.


