China's Great Deleveraging: From the World's Greatest Growth Engine to a ¥18 Trillion Property Collapse
- The Financial View
- Apr 17
- 8 min read
Published April 2026 | Global Macro Research | The Financial View
SECTION 01 — The Paradox: China's Dual Identity
China is not a poor country. It is not a failed state, and it is not a country in visible crisis. Its cities are modern, its infrastructure rivals anything in the developed world, and its companies — from Huawei to BYD to Alibaba — compete at the global frontier. In 2025, China accounted for approximately 19% of global GDP by purchasing power parity.
And yet. Behind that headline, something fundamental is breaking down. The economic model that powered four decades of the most extraordinary growth story in modern history — an architecture built on urbanisation, real estate, cheap credit, and local government land sales — is unwinding in real time. The unwinding is not dramatic. There is no Lehman moment. Instead, it is slow, grinding, and structural. And that makes it more dangerous, not less.
KEY INSIGHT: China did not stumble into a crisis. It systematically engineered a Ponzi-like growth loop between developers, households, and local governments. When Beijing tried to unwind it carefully via the Three Red Lines, it discovered that the loop was load-bearing — and pulling one thread unravelled far more than intended.
SECTION 02 — The Rise: How China Became the World's Growth Engine
To understand where China is today, you have to start in 1978. Deng Xiaoping's Reform and Opening Up policy reversed three decades of Maoist isolation. In 1978, China's GDP per capita was lower than Sub-Saharan Africa's. By 2014, it had surpassed the United States in purchasing power parity terms.
Growth averaged over 10% per year from 1980 to 2010. The 2008 Global Financial Crisis hit Western demand hard, and Beijing responded with a ¥4 trillion stimulus package — the largest fiscal response in the world relative to GDP. The majority was channelled into infrastructure and property, cementing real estate's dominance as the economy's growth engine.

KEY INSIGHT: The 2008 stimulus was the critical inflection point. It worked brilliantly in the short term. But it locked in the property-and-infrastructure model for another decade, making the eventual deleveraging far more painful than it needed to be.
SECTION 03 — The Real Estate Machine: How One Sector Took Over
By 2020, real estate had become the most important single sector in China's economy — not just as a share of output, but as the backbone of the entire financial system. At peak, real estate directly and indirectly contributed approximately 25% of GDP. Urban household wealth was approximately 70% tied to property. Local government land sales accounted for up to 50% of fiscal revenue.

From 2001 to 2019, Chinese residential prices quadrupled on average. In Beijing and Shanghai, prices rose more than 10% per year for nearly twenty years. Alternative investments offered poor risk-adjusted returns in a repressed financial system, so households kept buying. By 2021, property represented approximately 70% of urban household assets.

BEAR SIGNAL: The feedback loop between local government finances and property prices created a structural bias toward bubble inflation. No local official had any incentive to cool the market — their fiscal survival depended on it rising.
SECTION 04 — The Bubble Architecture: Developers, Households, Local Governments
China's property bubble was not a simple case of overvalued assets. It was a three-way financial architecture — a closed loop between developers, households, and local governments — where each party depended on the others to sustain the system. Local governments sold land to developers at rising prices. Developers pre-sold apartments to households before they were built. Households paid with savings and mortgages. The cash went back to developers, who bought more land. And the cycle continued.

By 2021, China was building approximately 1.5 billion square metres of new residential space per year — more than the rest of the world combined. In 2022, the mortgage boycott arrived: hundreds of thousands of homebuyers stopped paying mortgages on unfinished properties. It was not a revolution. It was rational desperation.


SECTION 05 — The Trigger: Three Red Lines and the Engineered Crash
In August 2020, Beijing's financial regulators met privately with 12 of China's largest property developers. The resulting Three Red Lines policy set three balance sheet thresholds: (1) liabilities-to-assets must not exceed 70%, (2) net debt-to-equity must not exceed 100%, (3) cash-to-short-term-debt must be at least 1.0x. Developers crossing all three were banned from taking on any new debt.
The logic was impeccable. The execution was catastrophic. When developers could no longer access new credit, they could not buy new land. Land revenues collapsed for local governments. Construction slowed, then stopped. Pre-sale trust evaporated.

BEAR SIGNAL: The Three Red Lines is one of the clearest examples in modern financial history of a well-intentioned regulatory intervention producing exactly the systemic crisis it was designed to prevent. China engineered the crash — but underestimated the second-order effects.
SECTION 06 — Case Study: Evergrande, Country Garden, and Vanke
Evergrande crossed all three Red Lines and was sitting on over $300 billion in liabilities. In September 2021, Evergrande warned the Guangdong government it was running out of cash. Markets plunged. Country Garden reported a net loss of ¥48.9 billion in H1 2023. Vanke, partially state-backed and once considered the most conservative major developer, came under pressure in early 2025 when its CEO was detained.

KEY INSIGHT: Evergrande revealed that the pre-sale model was, at its core, a duration mismatch: long-term construction risk funded by short-term consumer deposits. In a declining market with a regulatory credit freeze, this is a liquidity death spiral.
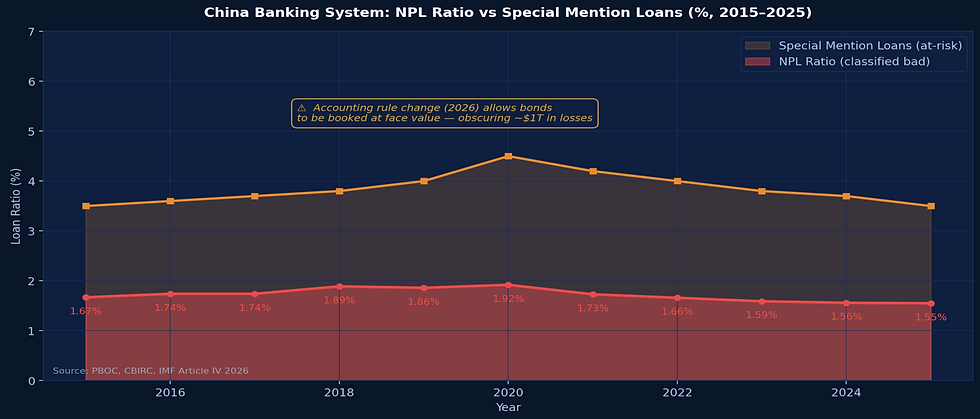
SECTION 07 — The Banking System: Hidden Risk and Creative Accounting
China's banking system did not cause the property crisis — but it is now deeply exposed to its consequences. The official NPL ratio stands at 1.55% in 2025, which appears reassuringly low. The reality underneath is considerably more complicated. In 2026, Chinese regulators amended accounting rules to allow banks to book bonds at original purchase price rather than market value — a move that echoes Japan's fatal mistake in the 1990s. The estimated gap between book and market value: approximately $1 trillion.


SECTION 08 — Consumer Weakness: The Wealth Effect in Reverse
China's property collapse has created a negative wealth effect at a scale the world has rarely seen. When 70% of a household's net worth is tied to a single asset class that is declining in value, the psychological consequences are severe. Household deposits in Chinese banks have nearly doubled since 2021, approaching a record ¥160 trillion by May 2025. That is not a sign of prosperity — it is a sign of fear.

Urban youth unemployment hit a record 21.3% in June 2023, prompting Beijing to suspend data publication for six months. Under the revised methodology, the rate peaked at 18.9% in August 2025 when a record 12.2 million graduates entered the job market simultaneously.


SECTION 09 — The Local Government Debt Crisis: Fiscal Reckoning
By 2021, land sales accounted for approximately 50% of local government fiscal revenue in many provinces. By 2025, that figure had collapsed to roughly 16% — a 68% decline in four years. The revenue hole is not a cyclical shortfall. Structural demand for housing in many tier-2 and tier-3 cities has genuinely declined.

KEY INSIGHT: China's fiscal system was structurally dependent on a collapsing asset class. The local government debt problem cannot be solved by property market recovery alone — it requires a fundamental redesign of central-local fiscal arrangements, which is politically complex and decades overdue.
SECTION 10 — Structural Headwinds: Demographics and Productivity
China's total fertility rate fell to approximately 1.01 in 2024 — the world's second lowest for a large economy, above only South Korea's 0.73. A rate of 2.1 is required to maintain a stable population. In 2025, 11.31 million people died while only 7.92 million were born. China has recorded four consecutive years of population decline, with the pace accelerating each year.


SECTION 11 — The Trade War Dimension: Tariffs, Decoupling, Export Risk
On April 2, 2025 — Liberation Day — US tariffs on Chinese goods escalated to 145%. At those rates, direct bilateral trade was effectively prohibited. Goldman Sachs estimated 10–20 million Chinese workers were involved in US-bound export businesses. By May 2025, the Geneva meeting produced a 90-day reduction to approximately 30%. As of early 2026, the effective US tariff rate on most Chinese goods stands at approximately 30% — historically high, but manageable.

SECTION 12 — Government Response: Controlled Deleveraging or Denial?
Beijing's response has been methodical and deliberately restrained. The policy toolkit includes: the White List lending program (¥200 billion); removal of purchase restrictions in most cities; reduction of the five-year loan prime rate to 3.5%; minimum down payment ratios reduced to 15% for first homes; and urban village renovation programs. The ¥10 trillion LGFV debt swap announced in 2024 improved fiscal transparency and reduced refinancing risk — but did not reduce the total stock of debt.
KEY INSIGHT: Beijing is making a deliberate choice: accept slower growth in exchange for long-term financial stability. Whether the calibration is right remains the central question of our time.
SECTION 13 — Global Impact: Why This Is Everybody's Problem
China is the world's largest importer of iron ore, copper, and coal. It accounts for approximately half of global steel and cement production. The property collapse has directly reduced that demand — reshaping commodity markets, compressing prices, and putting fiscal pressure on Australia, Brazil, South Africa, and dozens of emerging market economies. Meanwhile, Chinese industrial overcapacity in steel, chemicals, solar panels, and EVs is being absorbed through export dumping that is reshaping global manufacturing.
KEY INSIGHT: A Chinese economy growing at 4% vs 8% generates approximately $600–700 billion per year less in new demand. That deficit ripples across commodity exporters, luxury goods manufacturers, tourism destinations, and technology suppliers worldwide.
SECTION 14 — The Japan Comparison: Is This Japanification?
The structural similarities between China today and Japan post-1991 are striking. Both experienced debt-fuelled growth that produced asset prices wildly disconnected from fundamentals. Both had financial systems deeply embedded in real estate. Both experienced policy-triggered credit contraction. The balance sheet recession thesis — when the private sector focuses on debt repayment rather than profit maximisation, monetary policy loses traction — describes China in 2025 exactly.

However, China is not Japan. Three differences may limit the severity of Japanification: (1) China retains a larger urbanisation runway; (2) China's government has a longer-term strategic perspective; (3) China's per capita income at the start of its crisis is far lower than Japan's was in 1991, suggesting more catch-up potential once the debt overhang is addressed.

SECTION 15 — Future Outlook: Three Scenarios and the Investment Verdict

🟢 BULL CASE (15% Probability): Beijing executes decisive LGFV debt restructuring, introduces genuine fiscal framework reform, and channels the household savings surplus into productive technology investment. Property stabilises at 70–75% of peak values. Growth settles at 5%+.
🟡 BASE CASE (55% Probability): China muddles through. Property stabilises in tier-1 cities by 2026–2027 but tier-2 and tier-3 cities see continued weakness. LGFV debt is rolled over but not resolved. Growth averages 3.5–4.5% through 2030. Deflation risk persists.
🔴 BEAR CASE (30% Probability): A creditor loss of confidence in LGFV bonds triggers disorderly restructuring spreading to the banking system. Growth falls below 3% for multiple years. Regional fiscal crises in high-debt provinces create social instability. Long-term growth potential permanently impaired.
Short-term (2026): Chinese equities present selective opportunities in AI, EV, and advanced manufacturing. Avoid pure property plays. Medium-term (2027–2030): The technology pivot is real and well-funded. Distinguish between the old economy (property, construction, banking) and the new economy (tech, green energy). Long-term (2030+): A labour force projected to shrink 28% by 2050 means productivity growth must substantially accelerate just to maintain current output.
"The most important thing to understand about China's deleveraging is this: it is not a crisis that will resolve in a quarter or a year. It is a multi-decade recalibration of an economy that built too much, borrowed too fast, and sold the future to buy the present. The question is not whether it survives — it will. The question is what it looks like on the other side."
Published April 2026 | The Financial View | thefinancialview.org
DISCLAIMER: This report is for informational and educational purposes only. It does not constitute investment advice. All data sourced from PBOC, NBS China, IMF, World Bank, Goldman Sachs, S&P Global, and public financial disclosures.


Comments